This script tracks of Bitcoin's current USD price and displays it along with the price's "trend" since the script started running. The main part of the idea was borrowed heavily from this Stack Exchange article. It takes advantage of the coindesk API for getting current price information.
Sure, it's not a fancy line graph, but it's got ASCII-art up/down arrows!
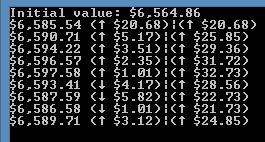
Here's an example screenshot:
And, the code:
import random
import json
import urllib.request
import time

# original concept/code borrowed from user polka at
# https://codereview.stackexchange.com/questions/116272/get-bitcoin-price-and-advice

delaySeconds = 60
currencyType = "USD"

def bitcoin(currency, amt = 1):
    url = "https://api.coindesk.com/v1/bpi/currentprice.json"
    response = urllib.request.urlopen(url)
    the_page = response.read()
    data = json.loads(the_page)
    conversion = data['bpi']['USD']['rate_float']
    return conversion

old_val = bitcoin(currencyType,1)
initial_price = old_val
print("Initial value: ${0:,.2f}".format(old_val)) # print an initial value (starting point)

while True:
    time.sleep(delaySeconds)
    new_val = bitcoin(currencyType,1)
    diff = new_val - old_val
    if diff < 0: diff = diff * -1   # make the diff a positive number
    if new_val > old_val: trend = "\u2191"  # are we trending up or down
    else: trend = "\u2193"
    old_val = new_val
    print("${0:,.2f} ({1} ${2:,.2f})|({4} ${3:,.2f})".format(
        new_val,
        trend,
        diff,
        new_val - initial_price,
        "\u2191" if new_val>initial_price else "\u2193"))